
Eric Zou
Electrical Engineering - Signal Processing - Medical Technology
Electrical Engineering - Signal Processing - Medical Technology
I'm a student at MIT studying Electrical Engineering and Computer Science.
I am currently a sophomore and have taken many EECS classes on various topics including analog electronics, power electronics, signal processing, MRI, and programming.
Currently, I am doing research at the Wellman Center for Photomedicine, where I work on developing optical imaging systems for medical applications.
This website is a portfolio that showcases the various things that I've worked on. Feel free to get in touch!
For my final project in my power electronics class, I designed and built a stepper motor driver from scratch and a feed-forward boost converter to power a stepper motor from battery-level voltage. Later, I designed a PCB for the motor driver.
I made this Github repository to store the files for this project. A full explanation of my power electronics is provided in this document, but a summary will be provided here.
A quick search on YouTube for “stepper motor music” will give many results showcasing the creative use of stepper motors to play musical notes and recreate songs purely out of what would otherwise be undesirable mechanical noise. I wanted to try playing music like this, and while I had some stepper motors that I had obtained for cheap, I did not have any motor drivers. I decided that for my power electronics final project, I would make a driver, and the final demo for the project would be to play a song on a motor.
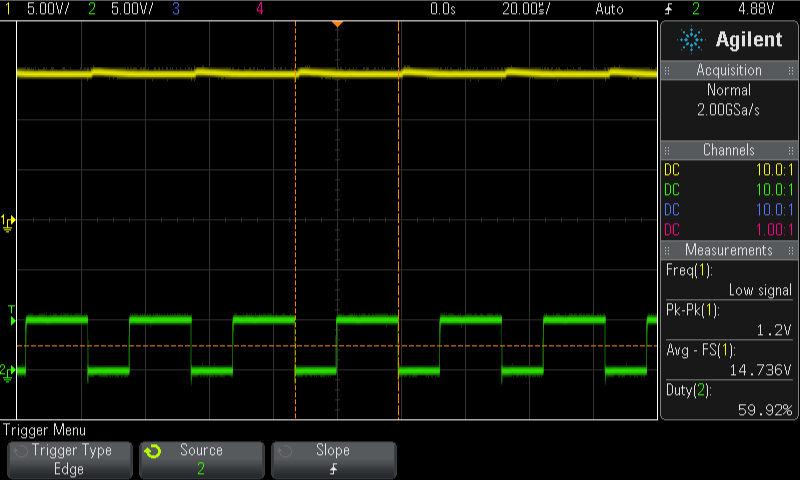
I decided to operate the stepper motor using full-step driving, where both coils in a bipolar stepper motor are energized at once but with different patterns to keep the motor spinning in one direction. Each individual coil can be energized by sending current in one direction for half a cycle, then flipping the polarity and sending current the other way for the other half-cycle. Both coils use this control pattern, but with a 90 degree phase offset. The driving can be accomplished using a H-bridge on each coil, such as the one depicted in this article. To produce the control signals needed to operate the H-bridges, I used a four-state finite state machine and some digital logic to create the following waveforms:
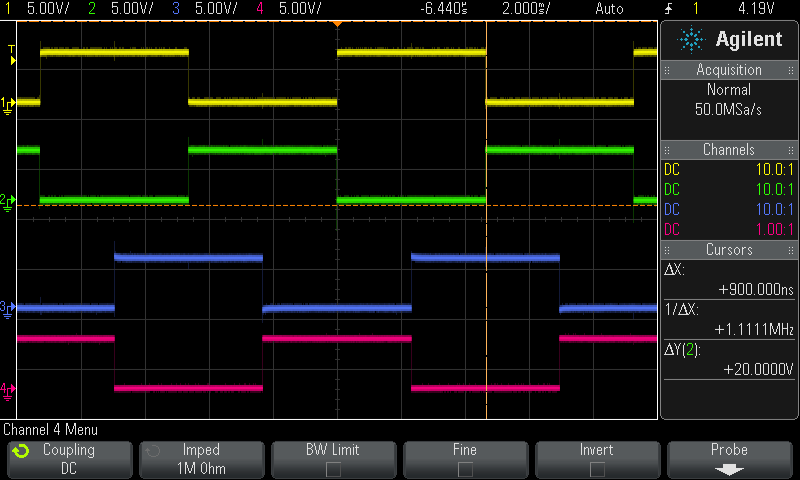
These waveforms are used as the control signals to MOSFET gate drivers to control the H-bridges and drive the motor. With VDD at 12 volts, the voltage across one H-bridge with the motor connected swings between 12V and -12V, with some distortion due to motor back EMF.

As an additional challenge, I sought to be able to power the entire system with a battery-level voltage (6V). To reach the voltage required for the motor and the MOSFET drivers in H-bridges, I designed a boost converter to take any input voltage less than 15 volts and bring it up to 15V. Initially, I had wanted to implement current-mode control; however, it quickly became apparent that such a feedback system was too difficult to implement in the time allotted for the project. So instead, I used a feed-forward system that computes the duty cycle needed for the boost converter to produce 15V at the output, and that controls the switch in the boost converter.
Additionally, since there is a MOSFET driver in this circuit that requires VCC of at least 12V to operate correctly, I also created a self-start circuit that would bring the boost converter output voltage up to 15V before shutting off and allowing the MOSFET driver to take over and run off the boosted output voltage. An example of the boost converter output voltage across a 100 ohm power resistor with 6V input is shown below. More details are availble in my project report.
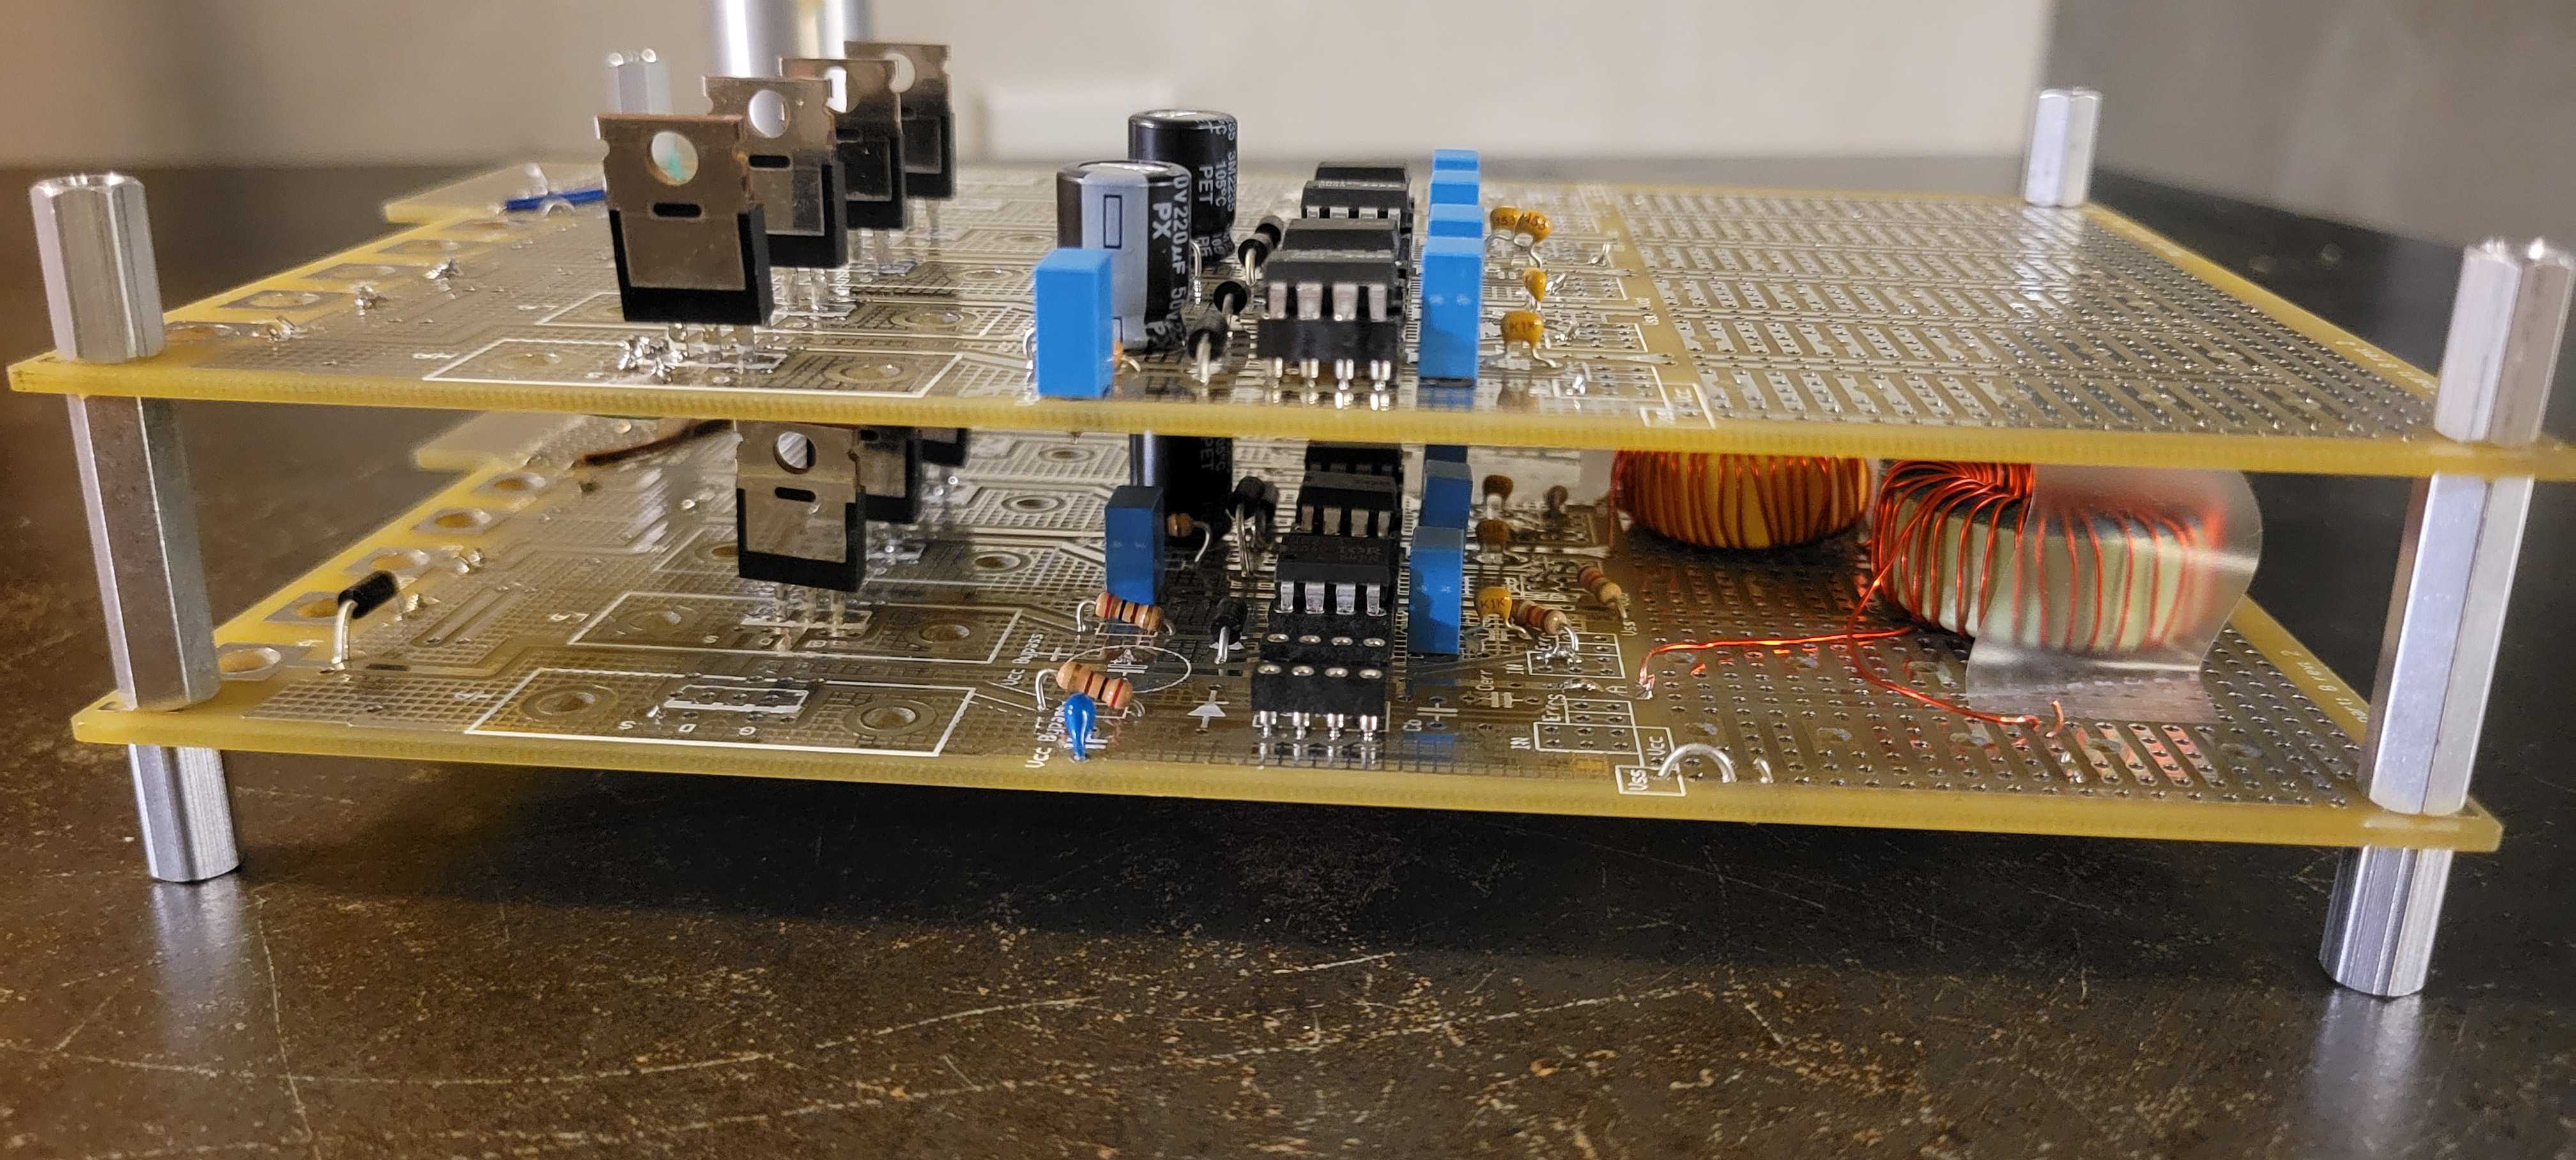
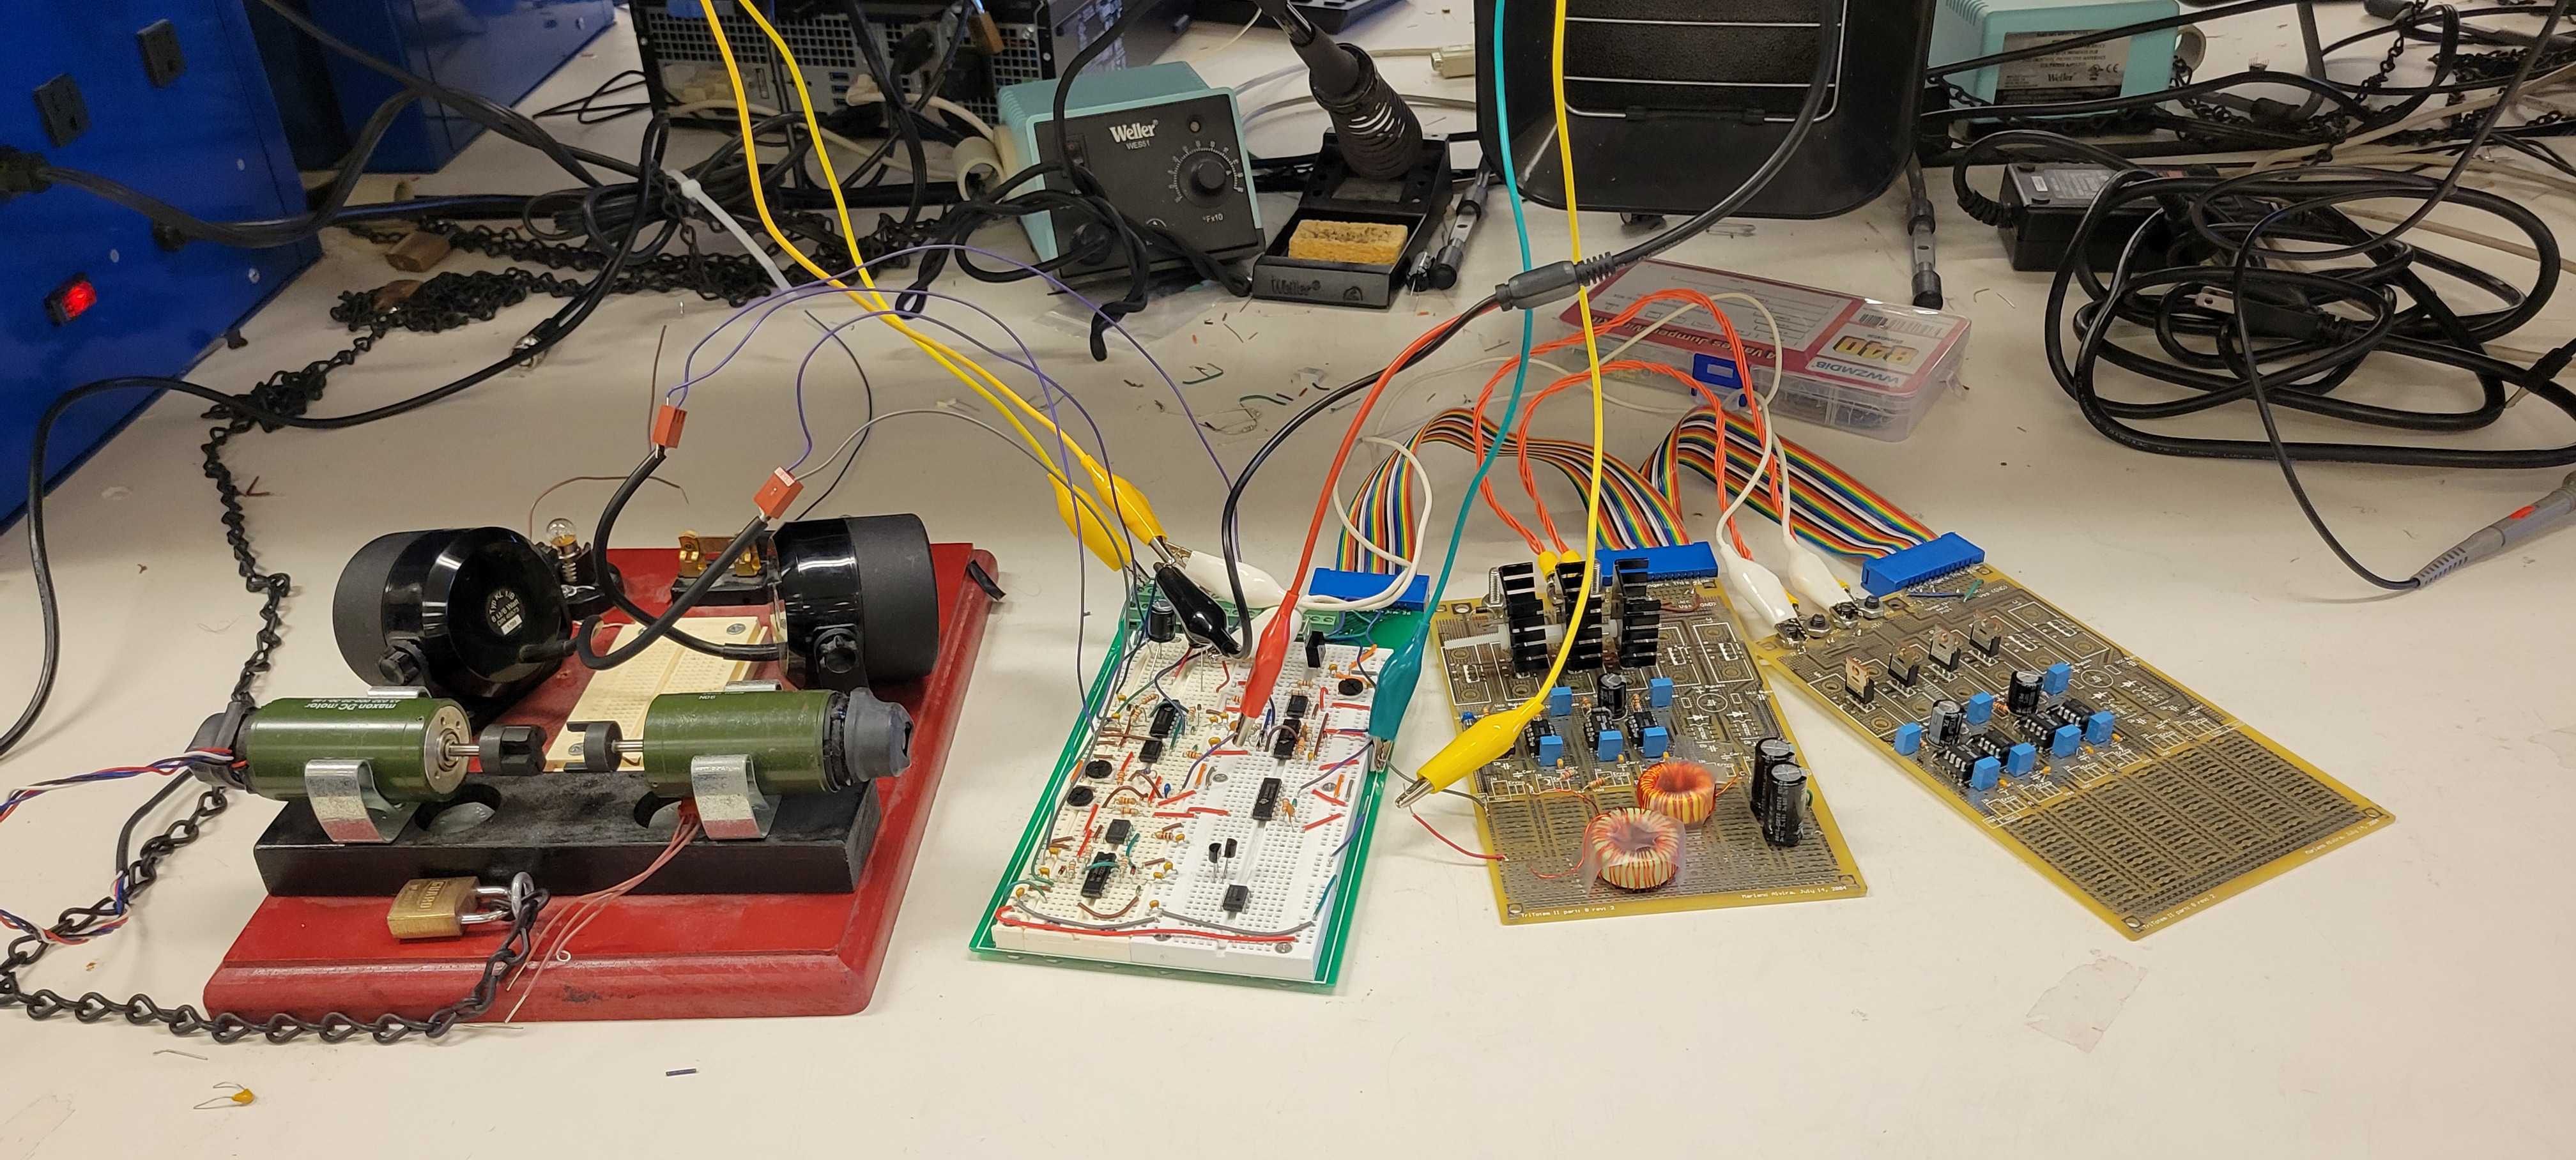
By the end of the project, my circuitry spanned my whole desk space across 5 boards. But I was able to play music! I used the oscillator controlling the motor driver to play specific frequencies that would let me play “Mary Had a Little Lamb” on the motor.
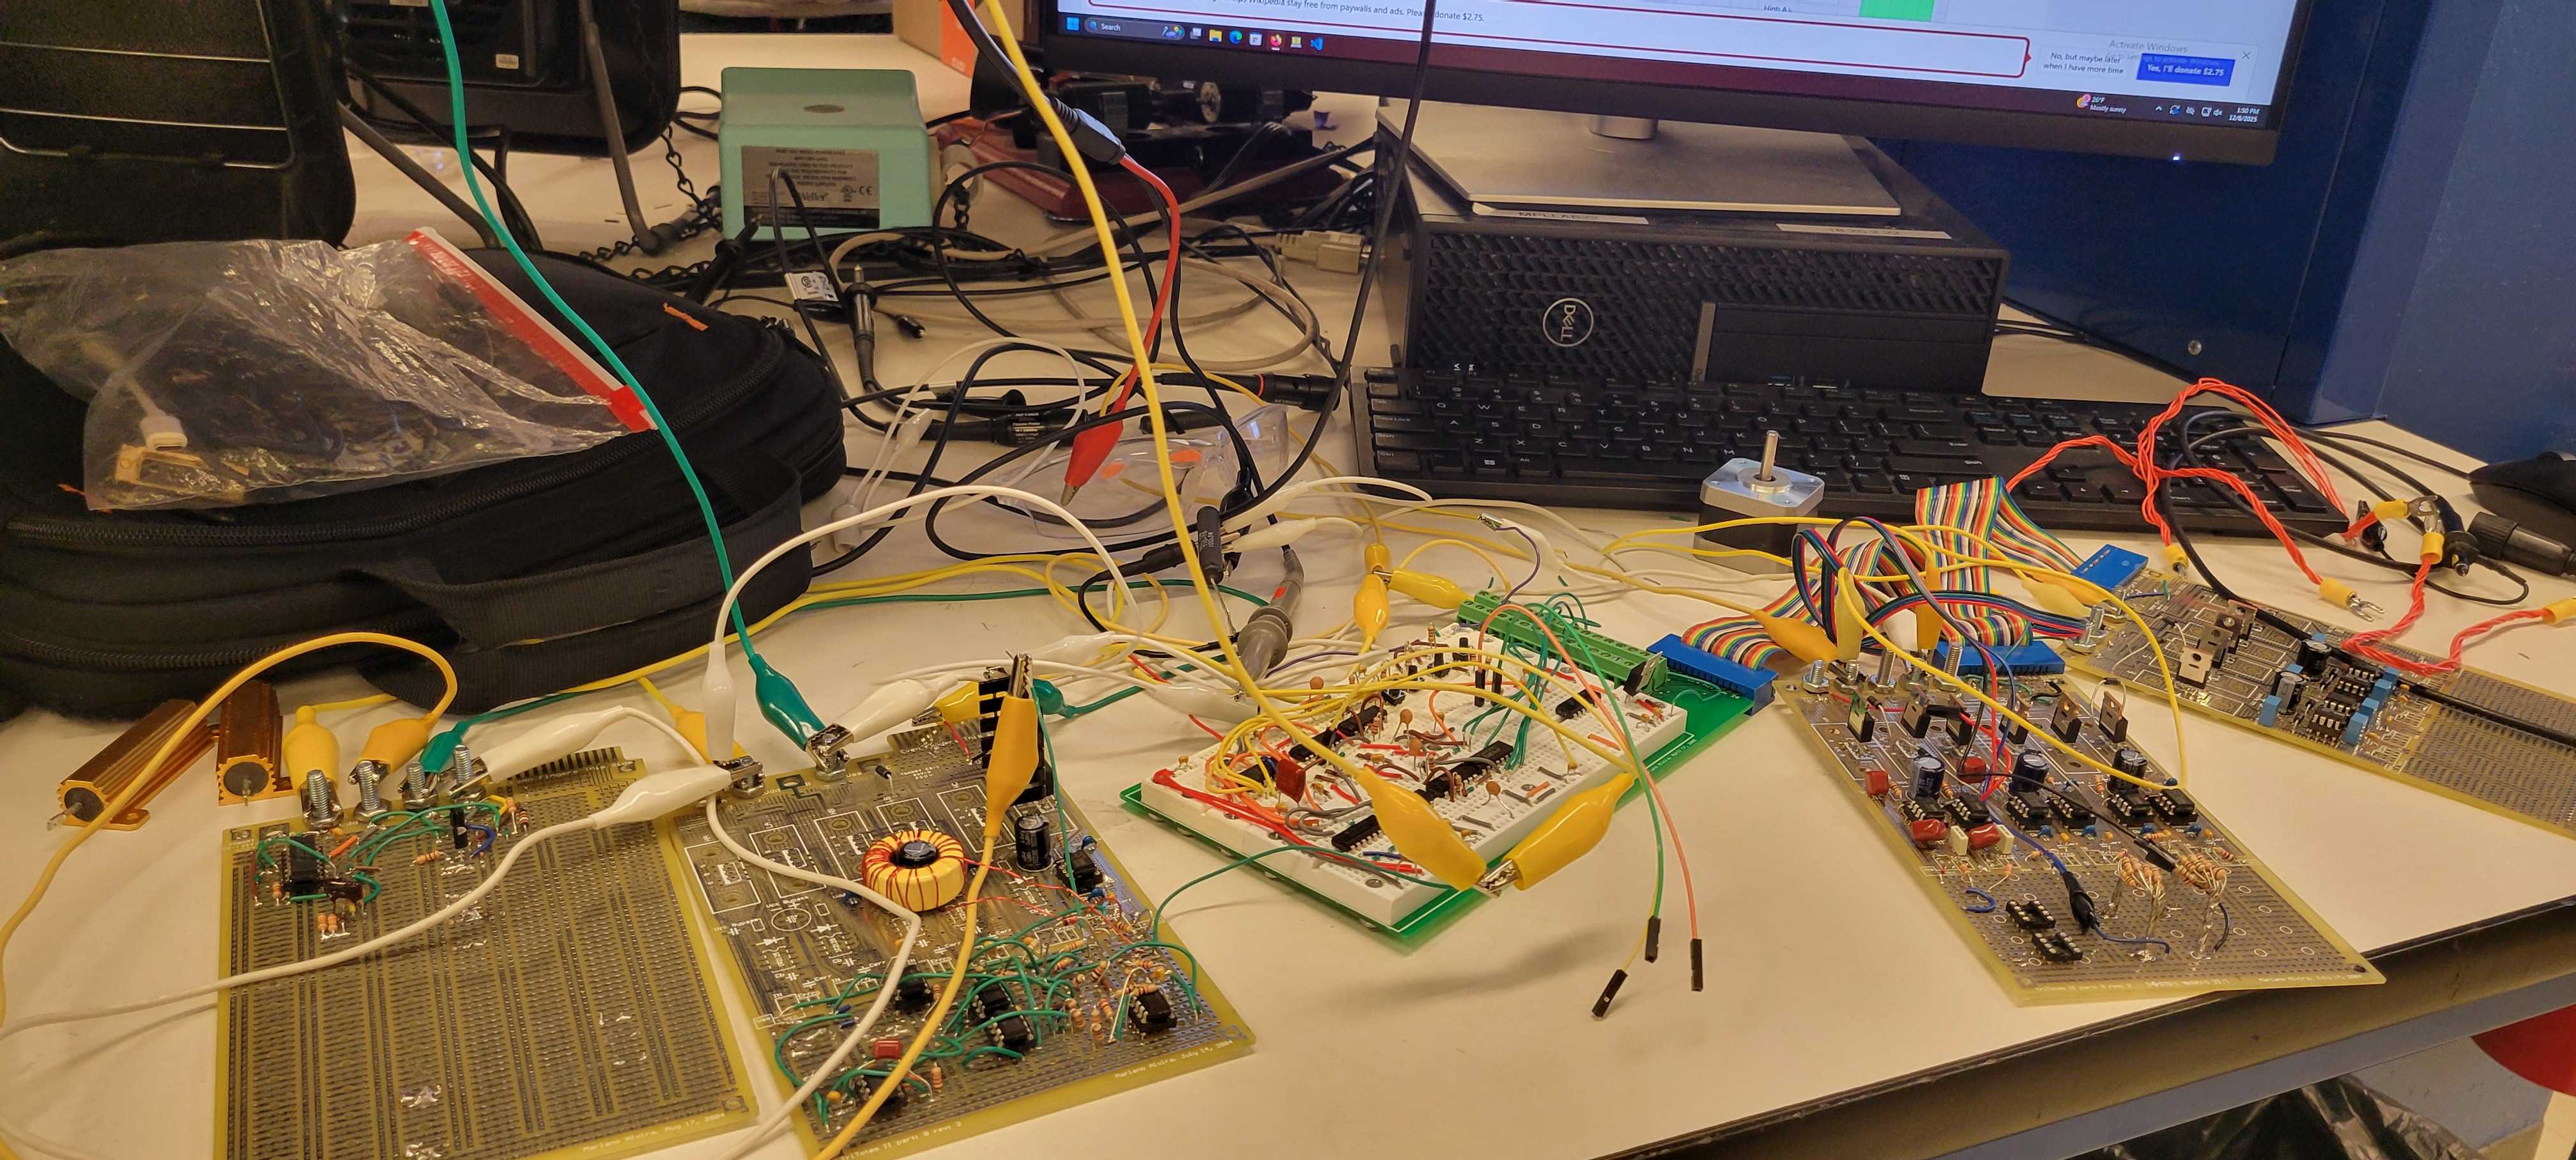
I did a rough estimate and calculated that the overall efficiency of the system was around 50%, which is not great. I suspected that when the motor was running, the boost converter output voltage was sagging enough for the self-start circuit to turn on again, which was pulling more current and wasting more power.
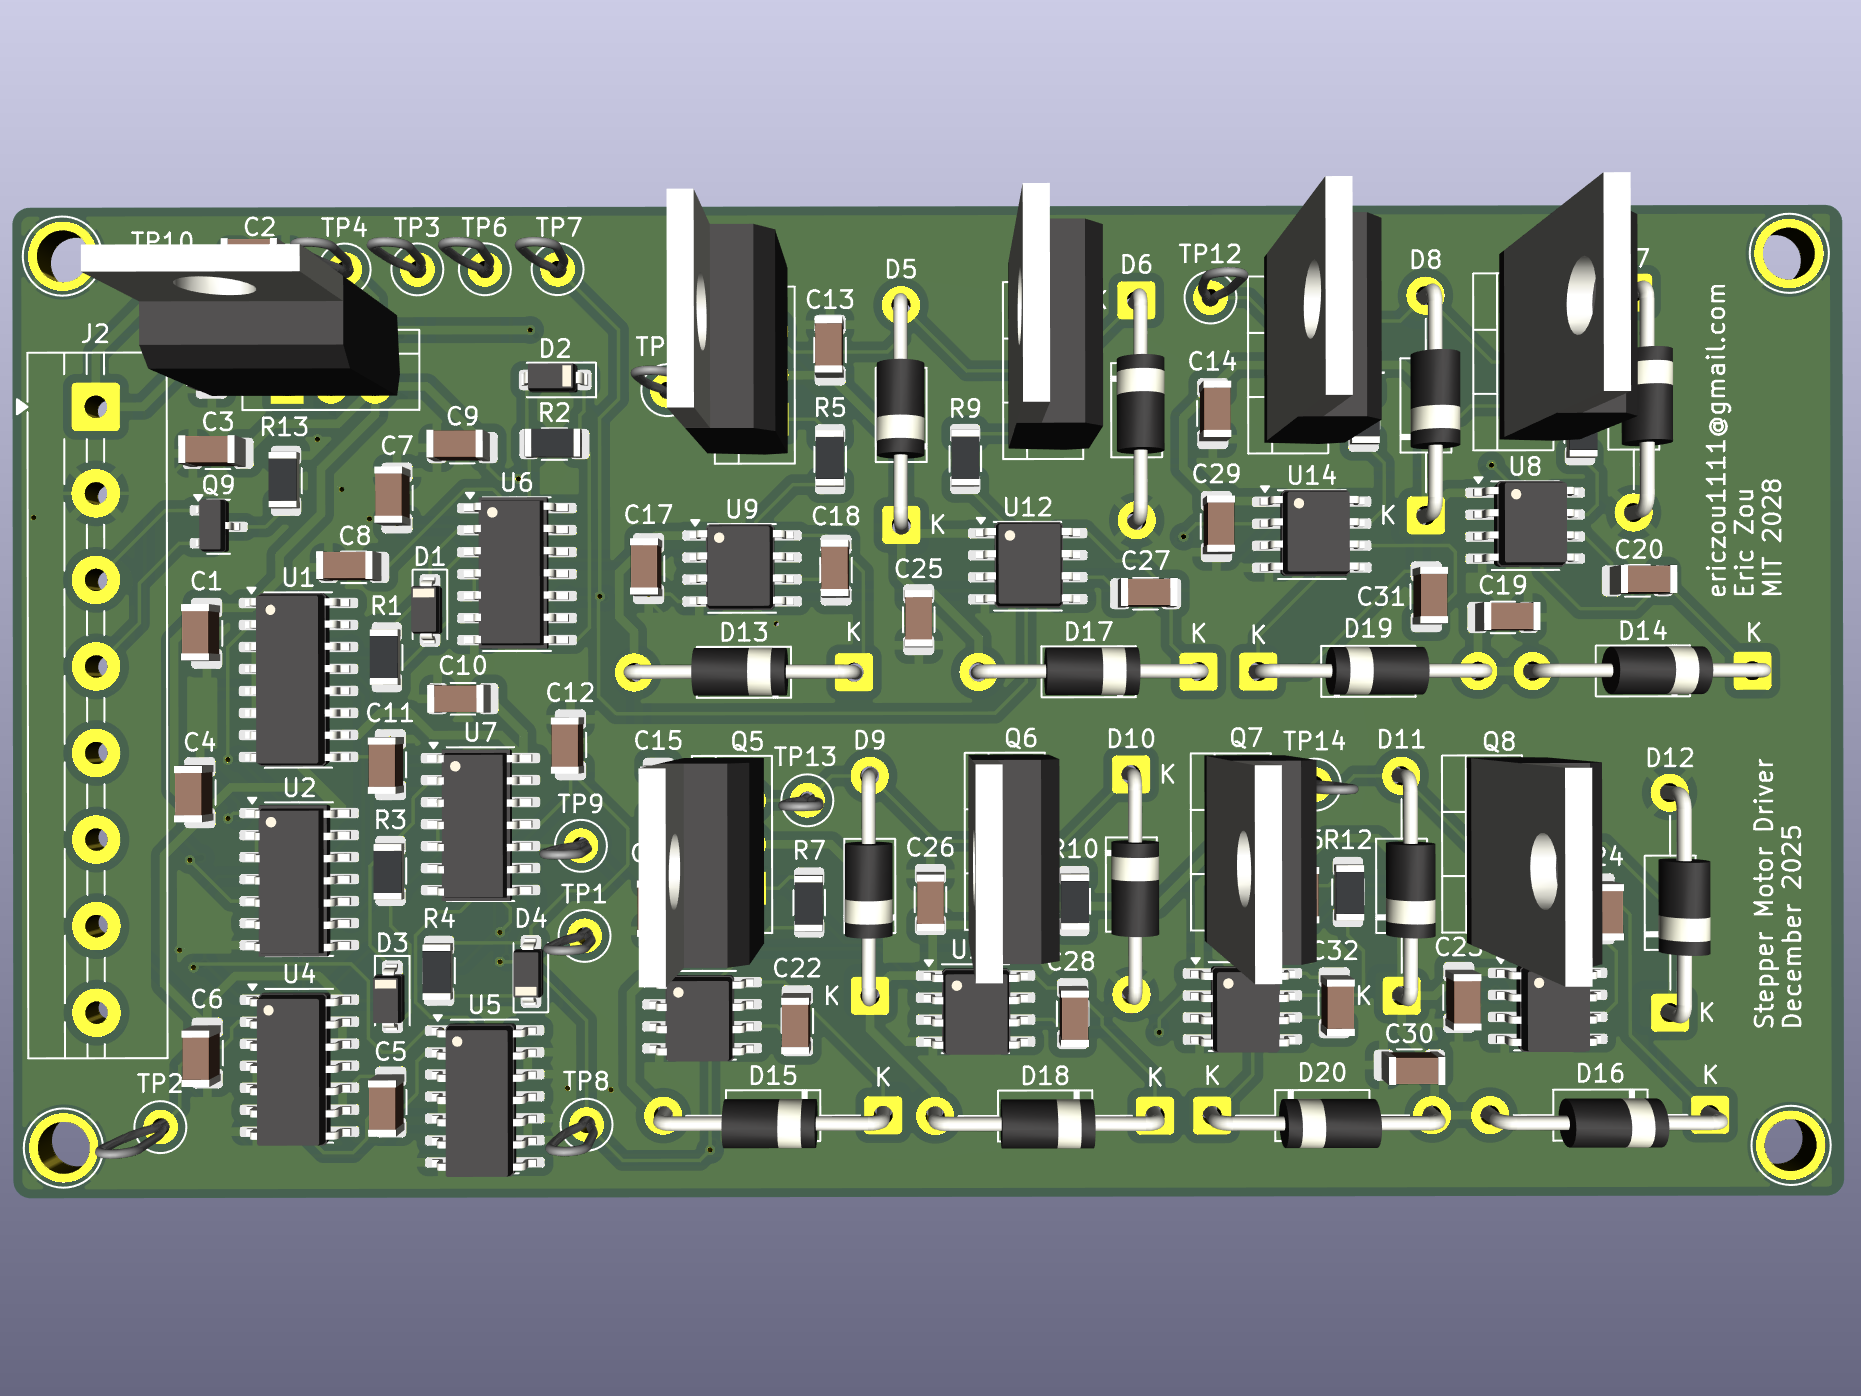
Currently, I am working on a PCB for the motor driver without the boost converter, which is also the thumbnail for this project post. I will add more details on that here later. Additionally, some things I would like to add in the future are direction control, current limiting with a chopper, and other driving patterns like half-step, wave drive, and microstepping.
This is a terminal-based typing speed test that I made using Python and the curses library.
The Github repo has all the code and instructions for running the test.
The typetester implements two types of tests: finite and continuous. A finite test has a finite number of words that the user specifies and times how long the user takes to type them. A continuous test asks the user for a test duration, and the user types as many words as possible in the alloted time. Words per minute (wpm) is defined in the typical standard as the total number of characters typed, divided by 5, and normalized to a total time of 60 seconds.
In my power electronics class, we were tasked with determining component values that would be suitable for an adjustable LED lamp powered by a boost converter operating in discontinuous conduction mode.
A boost converter is often operated in continuous conduction mode, where the inductor always has current running through it, but it can also be operated in discontinuous conduction mode. When operating in CCM, the boost converter acts as a duty cycle-controlled voltage source, while when operating in DCM, the boost converter acts as a duty cycle-controlled current source. By using the boost converter as a constant-voltage current source, we can light the LED with different brightnesses by varying the duty cycle. To ensure that the boost converter remains in DCM, the inductance of the inductor must be below a certain threshold value.
Below is a video of the lamp in action.
During my power electronics class, we were tasked with applying our class content to determine appropriate design parameters for an adjustable audio amplifier powered by cascaded buck and boost converters.
The entire audio amplifier was powered by a 6 volt power supply. A boost converter stepped this voltage up to 15 volts, and then a buck converter stepped 15 volts down to a variable output voltage which could be tuned by turning a potentiometer. This voltage is used as the high side power supply of a totem pole that drives a speaker. The control signal for the totem pole is produced with a comparator that has the audio signal as an input, which is how the audio is coupled into the system. During the lab, we were asked to calculate various component values that would produce desired switching frequencies, ensure that the inductors of both the boost and buck converters would remain in continuous conduction mode, and yield a particular output voltage with small ripple.
Below is a video clip of me adjusting the frequency of the input sound. The recording doesn’t show it too well, but it was very loud!
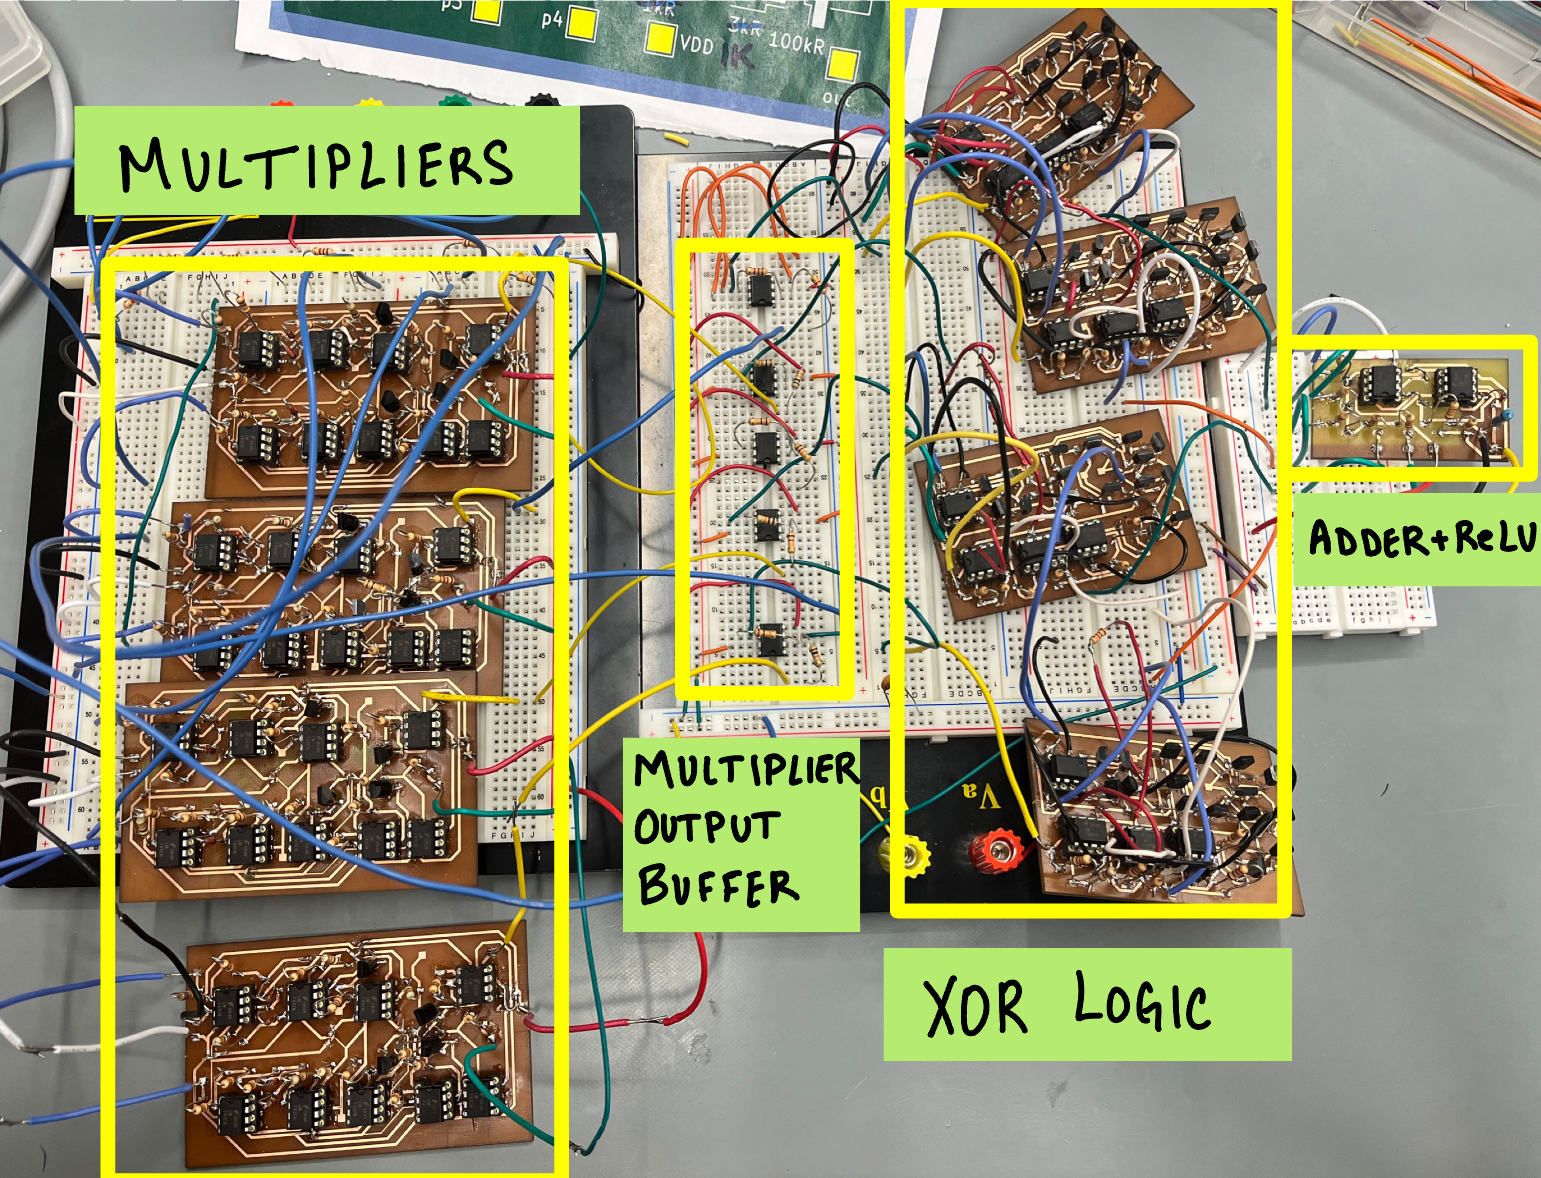
For our final project in our analog electronics class, my teammates and I created a circuit that performs the computations necessary for the forward propagation stage of an analog neural network.
My project team in analog electronics had hearad about FPAAs, the analog counterpart to FPGAs, and we thought it would be cool to make an analog neural network. Due to the time constraint of the final project, however, we were advised not to attempt the “learning” portion of the neural network and to simply focus on the forward propagation steps.
In a typical neural network, there are many neurons which each perform forward propagation as the result of 3 operations: multiplication of inputs by weights, addition of a bias, and activation function. Our project implemented all three of these operations in conjunction.
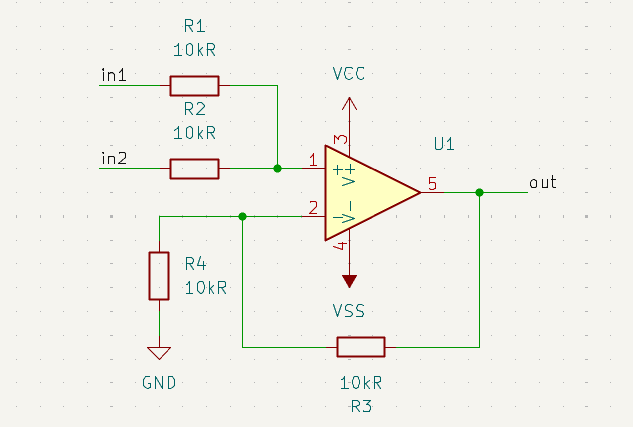
To add two voltages, we used a noninverting op amp summer, which averages the input voltages and then amplifies to scale the mean into the sum. The summer worked well for any voltage between the supplies of the op amp.
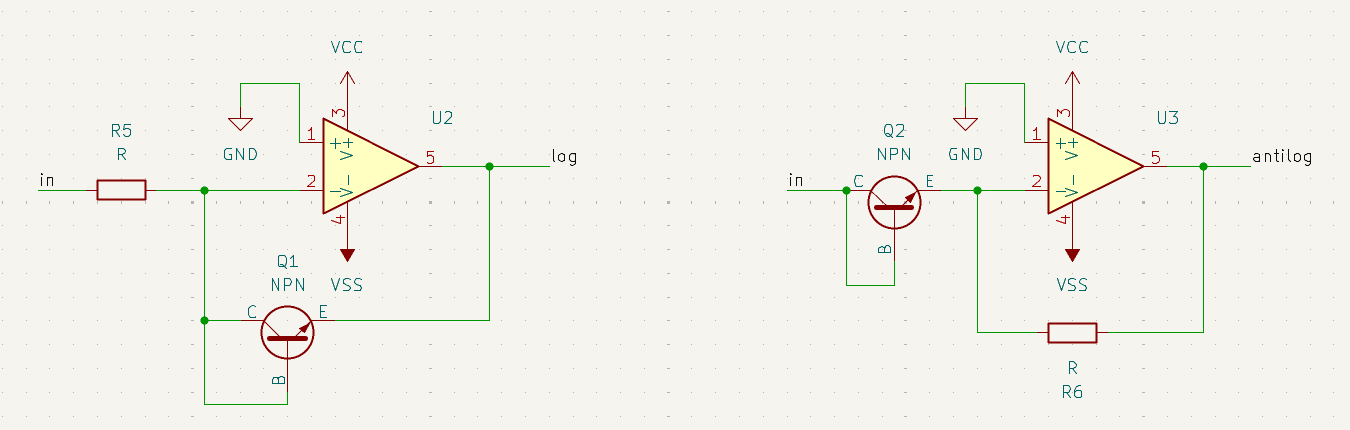
We tried to make several topologies for multiplying voltages, including the Gilbert cell, but were unsuccessful with getting them to work outside of simulation. After a significant amount of trial and error, we were successful at using a modified log-antilog multiplier to multiply two voltages. The circuit utilizes the fact that adding the logarithms of two numbers is equal to the logarithm of their product.
The logarithm circuit exploits the fact that the diode i-v curve is exponential. By using this property, an op amp circuit can be used to get an output voltage that is proportional to the natural logarithm of the input.
A big limitation with the log-antilog multiplier is that it can only perform single-quadrant multiplications; that is, the inputs must both be positive, since taking the logarithm of a nonpositive number is nonsense. To deal with this, I came up with a workaround: we could take the absolute value of the inputs and use those to find the absolute value of the product using the log-antilog multiplier. Then, we would choose to invert that answer depending on how many of the inputs were negative.
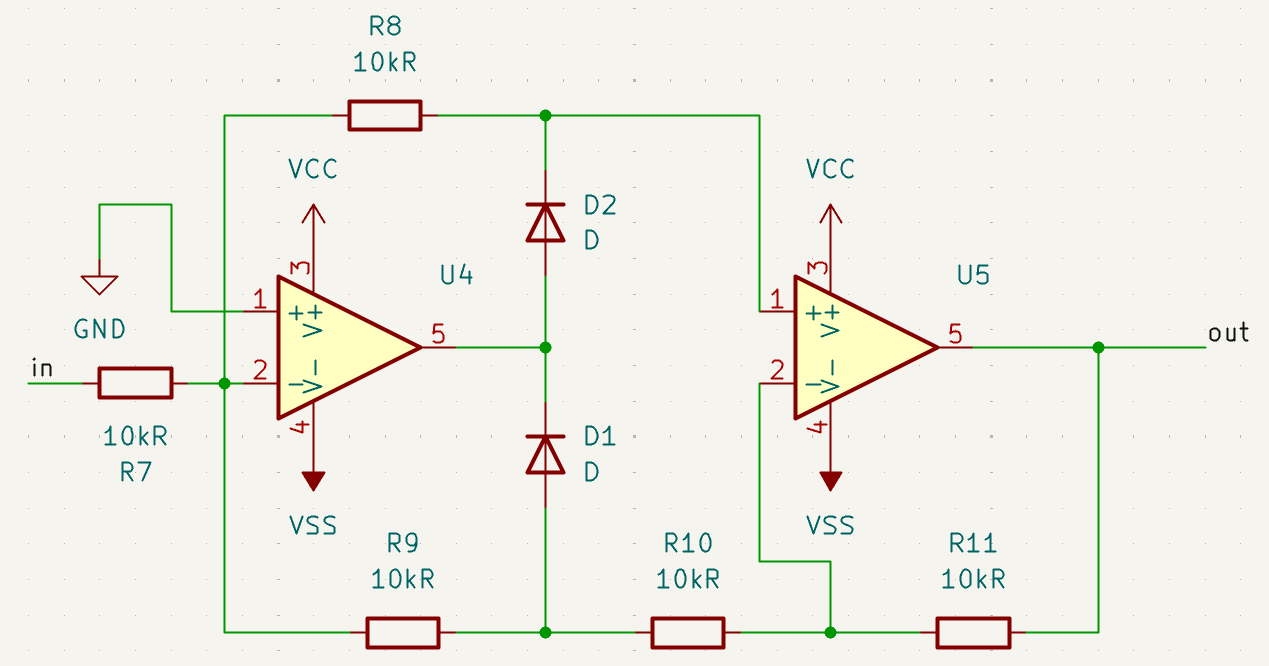
The absolute value circuit is shown below. It uses two op amps and two diodes to keep positive inputs and invert negative ones.
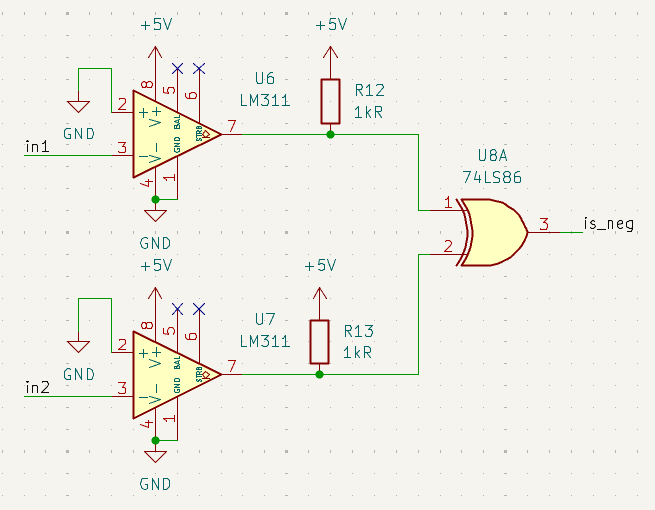
If exactly one of the inputs is negative, then the product will be negative. Otherwise, it is positive. To determine whether the product is negative, we can use a XOR gate. The below shows a simplified interpretation; during the project we did not have access to an XOR gate and instead constructed our own out of logic MOSFETs.
This signal is used as the control to select between two voltages using another MOSFET: one at twice the magnitude of the product of the inputs (produced using a noninverting amplifier) and ground. Then, the magnitude is subtracted from whatever is outputed by the multiplexer. This gives the correct answer regardless of whether the answer is positive or negative.
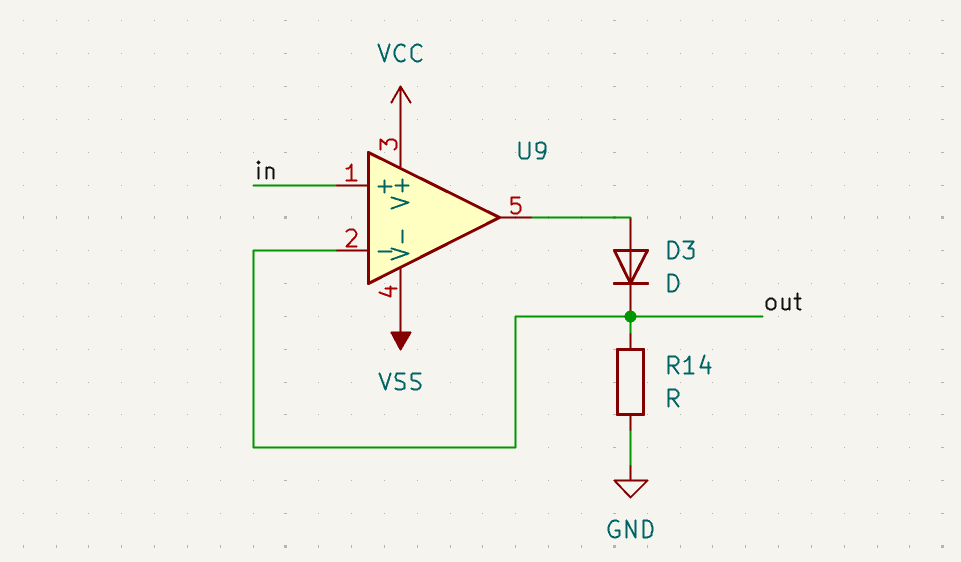
Different neural networks may opt to use different nonlinear activation functions. The simplest one is ReLU, where positive inputs are kept the same and negative inputs are set to 0. This would simply be the behavior of an ideal diode. Since real diodes have a “turn on voltage” which would be lost if we simply fed the signal to the diode, we used precision rectifiers instead of real diodes to eliminate that error.
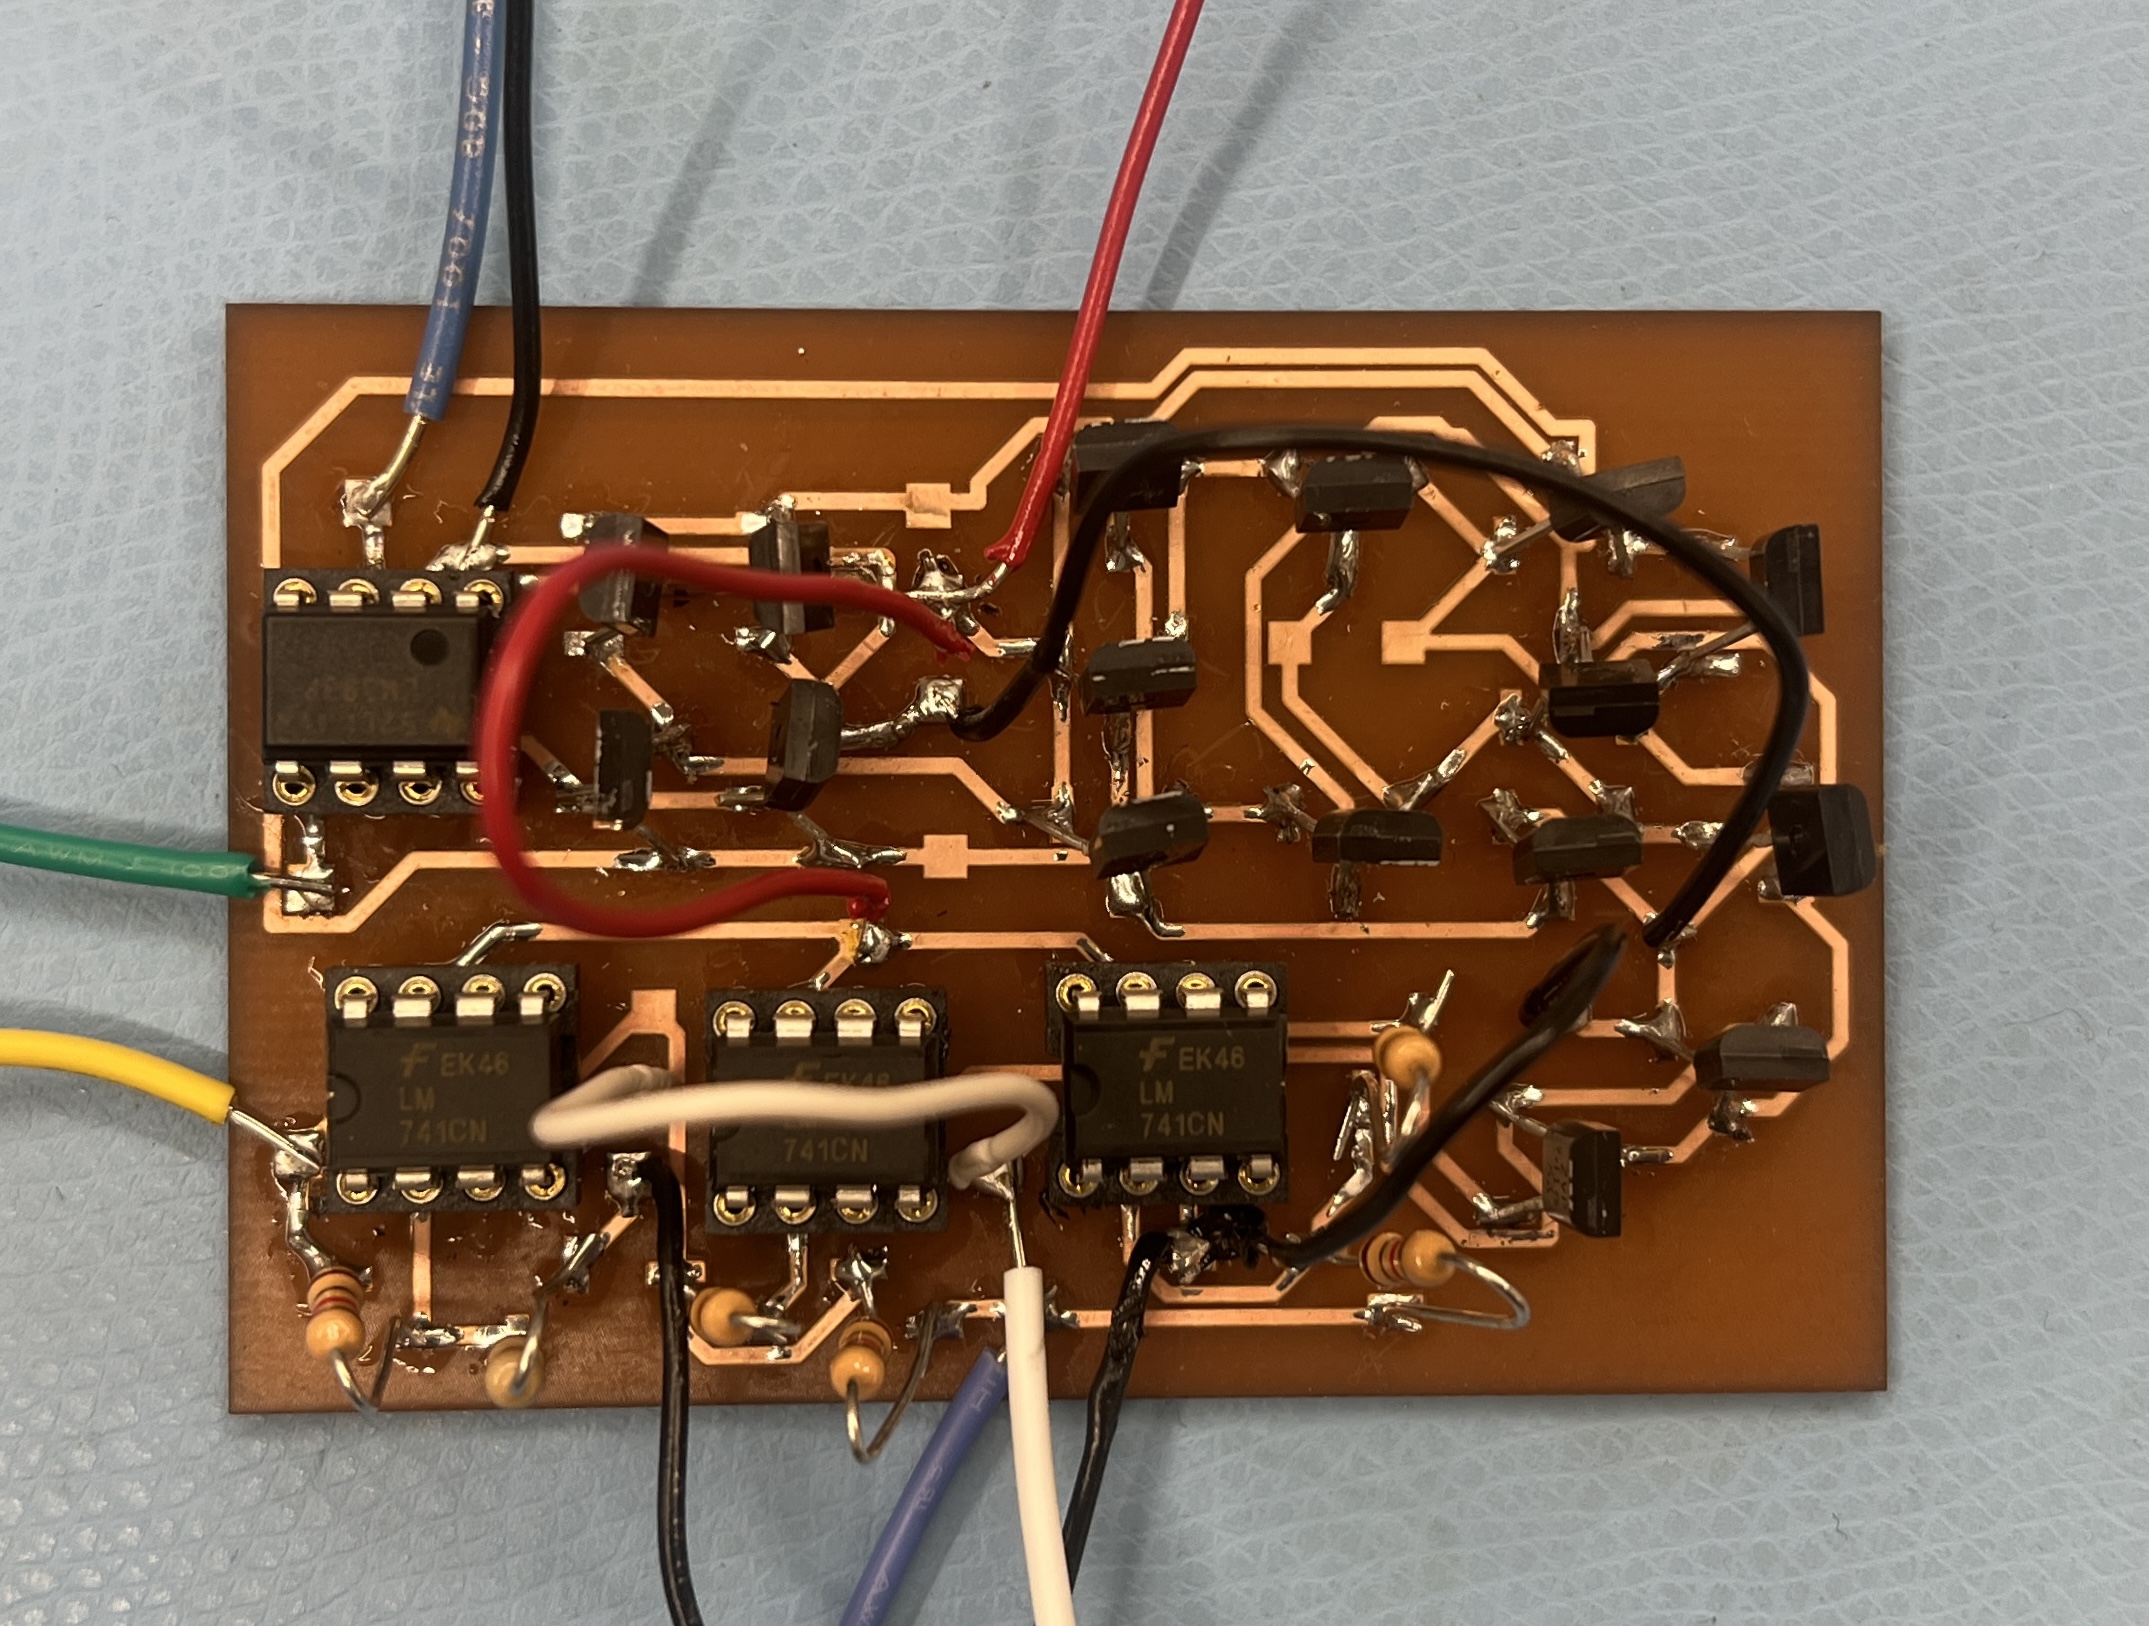
At the end, we fabricated some single-sided PCBs with all the circuits. When fully put together, the full neuron performed decently but had significant amounts of error in the calculations at times. The main takeaway is that while analog computations are definitely faster than clocked digital computation, accuracy is the tradeoff.
I made a four-band resistor color code calculator in Python.
The code for the project is available in my Github repo. I wanted the calculator to be accessible from the terminal, so I wrote the calculator using the tkinter library. From the color bands, it gives the tolerance, the nominal value, as well as the minimum and maximum possible values given the tolerance.
In high school, I built a photoacoustic probe in order to test the ripeness of watermelons. This was a multi-year project that culminated in the publication of a manuscript in IEEE Sensors.
All the technical details can be found in this manuscript, but a fairly detailed summary of the project is given here.
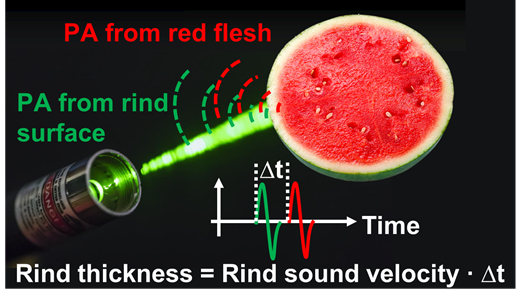
The quality and taste of a watermelon depend mostly on its degree of ripeness. Many different properties of the watermelon change during ripening, but two important ones are the redness of the flesh and the thickness of the rind. In particular, as the watermelon ripens, the flesh becomes more red due to lycopene buildup while the rind thickness.
Cutting open the watermelon is a very easy way to determine its ripeness, but we would obviously prefer a nondestructive method for ripeness detection. Some of the methods used include acoustic methods like knocking on the watermelon and NIR spectroscopy, but these have faced various limitations. I wanted to use a photoacoustic method to determine watermelon ripeness.
By shining a pulsed laser onto a watermelon, some of the light will be absorbed on the outside skin, and some will transmit through the skin and be absorbed at the inner flesh. These two areas of absorption will rise in temperature and expand, each producing a photoacoustic wave which can be detected. The time delay between the two waves, multiplied by the speed of sound through the watermelon, should equal the thickness of the rind. Meanwhile, the strength of the wave from the inner flesh should correlate with flesh redness.
In order to determine the feasibility of using photoacoustics for detecting watermelon ripeness, I performed some characterization experiments on the watermelon rind and then performed a feasibility experiment using what I learned. A summary of my findings is given below.
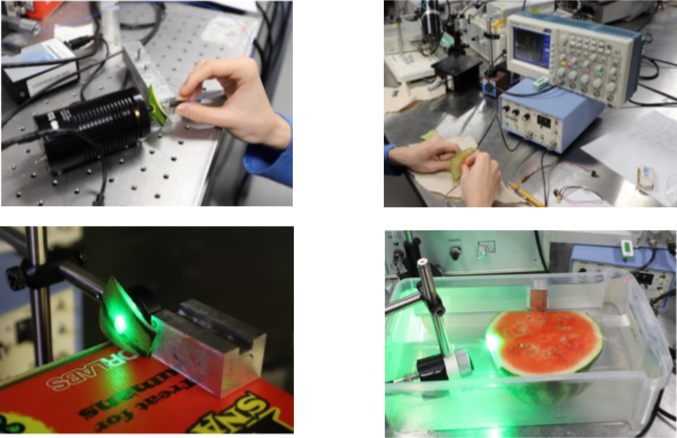
I used a spectrometer to determine the transmission spectrum of watermelon rind in order to determine what laser color would be best for reaching the inner flesh. I found that green or blue light had the greatest transmission, so I settled on a laser wavelength of 532 nm.
Then, using a 532 nm laser, I observed the transmission when varying the excitation spot and the rind thickness. As expected, thicker rinds had lower transmission due to scattering inside the rind, while darker spots on the surface resulted in greater absorption at the surface, reducing the overall transmission.
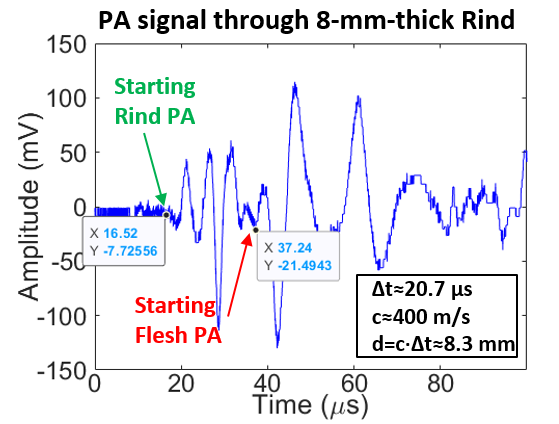
Using a pulser-receiver and two ultrasound transducers, I also determined that lower frequencies transmit through the rind better than higher frequencies and that the speed of sound through the watermelon rind is approximately 400 m/s.
With this knowledge, I set up a feasibility experiment, where a 532 nm pulsed laser shined onto a watermelon half and an ultrasound transducer received the photoacoustic signals. The watermelon and transducer were submerged in water for better acoustic coupling. The waveforms that I collected were good quality, and I was able to visually identify the beginnings of the waves coming from the skin and flesh respectively. When I took the time difference and multiplied by the speed of sound, I got results that were close to the actual rind thickness, so I concluded that this method was feasible. An example of a PA signal is shown below.
I presented this work at Regeneron ISEF and received 3rd place in Embedded Systems.
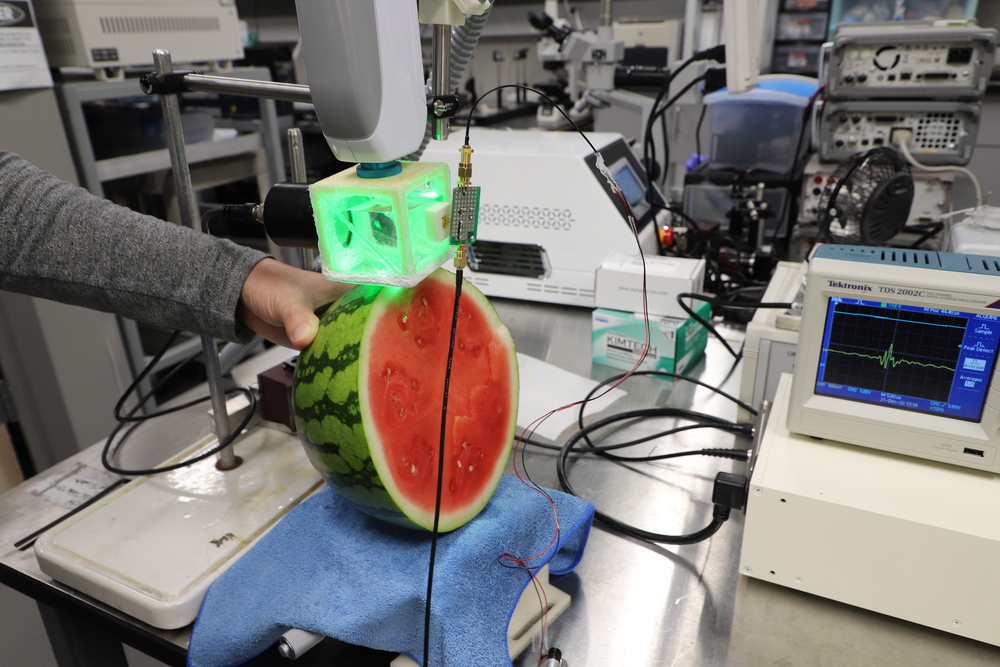
After determining that the idea was feasible, I set out to create a more compact and practical design for the ripeness detector. An image is shown below.
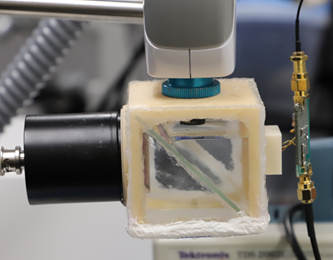
The 3D printed cuboidal structure can be screwed directly onto the laser head, and the ultrasound transducer can be screwed onto the side via a 3D printed piece. The opposite side has a photodiode that is used as a trigger signal for synchronization during data collection. Inside the cube, there is a glass pane which is transparent to the laser beam but reflective to ultrasound, so the laser light can shine straight onto the watermelon while the photoacoustic waves will be reflfected toward the ultrasound transducer. Additionally, water inside the cube serves for acoustic coupling. The sides are made out of clear acrylic to avoid absorbing any extra light and interfering with measurement of the signal of interest. The bottom is made of food-wrap to provide a surface that will conform to the watermelon.
Some new additions were also made to the design of the photoacoustic probe that were not present in the feasibility study. An optical filter was added in front of the laser beam to only allow 532 nm laser light through and block other extraneous wavelengths produced by the laser. Additionally, an acoustic lens was made for the ultrasound transducer out of PDMS for better signal pickup.
I first tested the probe’s ability to determine rind thickness and then tested the ability to determine flesh redness.
To test rind thickness detection, I took a watermelon and removed layers of rind to simulate different rind thicknesses. I used a cross-correlation algorithm to compare each signal to one in which I had manually determined the two PA waves, and using the calculated time delay, I calculated the rind thickness. I found fairly accurate estimates of the rind thickness this way.
For flesh redness testing, I simulated different redness levels by making different solutions of red ink and placing them in plastic bags under the same depth of rind. From each signal, I subtracted a “background” signal where there was no ink bag and normalized the difference. After using cross-correlation to determine the location of the inner flesh PA wave, I am able to compare the relative signal strength of the different concentrations of ink. Again, I found promising results, with the signal strength improving with concentration.
For fun, I also fed everything into a bag of SFA symbols (BOSS) classifier and found that the classifier was able to achieve high accuracy when classifying both rind thickness and flesh redness.
I made some modifications to the design of the probe later and did more testing. More details are available in the manuscript.